Online monitoring of experiments
The ScriptEngine runtime environment allows for online monitoring of experiments. The monitoring system can collect data from ongoing model runs and compute metrics that allow for a quick overview and assessment of running experiments. The computed metrics are stored as NetCDF files in the run directory and are available for manual evaluation. At the same time, the system can produce plots from the monitoring metrics and make a graphical representation locally on disk or automatically and continuously uploaded to the SMHI Gitlab. The monitoring system is controlled by configuration parameters in the ScriptEngine runtime scripts.
Basic monitoring configuration
The monitoring system is activated by setting experiment.monitoring.activate
to true in the runtime scripts.
This setting is typically found in the experiment configuration script.
base.context:
    experiment:
        monitoring:
            activate: true
Monitoring can be activated for already ongoing experiments, but monitoring metrics will only cover experiment legs for which monitoring has been switched on at the start of the leg. Switching off monitoring and again on later during the experiment is not supported.
The script that controls online monitoring is found in
scripts/runtime/scriptlib/monitoring.yml.
Monitoring metrics
If the monitoring system is activated, it will run at the end of each leg and
produce monitoring data in {{experiment.run_dir}}/monitor.
For most monitoring metrics, the data will be stored in NetCDF files.
These date in these files is complemented by detailed meta-data attributes and
should therefore be useful for most evaluation tools.
If presentation of the monitoring metrics at the SMHI Gitlab is not
configured (see next section), the monitoring system will produce a Markdown
page including plots in the {{experiment.run_dir}}/monitor/markdown
directory.
This can be used for manual inspection of manual uploading to a website that
supports Markdown.
List of monitoring metrics
General and technical metrics
Experiment id, description and notes
Number of simulated years
Disk usage
Simulation speed [Simulated years per day]
Atmosphere metrics
Near-surface air temperature
Sea-level pressure
Precipitation - evaporation
Precipitation
Evaporation including sublimation and transpiration
Net TOA
Net SFC
Net TOA-SFC
Surface net solar radiation
Surface net thermal radiation
Top net solar radiation
Top net thermal radiation
Total cloud cover
Ocean metrics
Sea surface temperature
Sea surface salinity
Sea surface height
Ocean temperature (3D)
Ocean salinity (3D)
Sea-ice metrics
Sea-ice area/fraction March/September northern hemisphere
Sea-ice area/fraction September/March southern hemisphere
BGC metrics
Total denitrification
Global total nitrogen fixation
Total Flux of Carbon out of the ocean
Cumulative total Flux of Carbon out of the ocean
Total Carbon export at 100m
Global total integrated primary production
Global mean nitrate concentration
Global mean phosphorus concentration
Global mean silicate concentration
Global mean alkalinity concentration
Global mean iron concentration
Presentation on Gitlab
Besides storing the monitoring metrics locally on disk, the system can create plots and upload them to the SMHI Gitlab. Thus, the status of the ongoing experiment becomes immediately published and can be shared continuously between EC-Earth users.
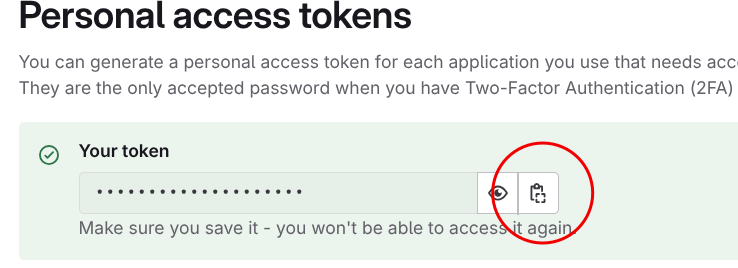
In order to access Gitlab for the automatic publication of results, the monitoring scripts need to authenticate via a personal access token. This can be created on the SMHI Gitlab under Preferences > Access Tokens:
Click “Add new token” in the upper right corner.
Provide a name for the token (e.g., “Monitoring”)
Adjust the expiration date (the longest possible duration is one year)
Under “Select scopes”, make sure to tick the box “api”.
After you have created the token, make sure to copy it directly and store it in a safe place.
Once the access token is created, it needs to be copied to
{{experiment.monitoring.gitlab_api_key}}, usually defined in the user
configuration script of the runtime environment:
base.context:
    experiment:
        monitoring:
            gitlab_api_key: 57d49f05da3e606b4000ce4895597ac7a52197bc
Note
The key in the above example is just a random string, not a real access token!
Warning
It is important to keep your access token secret! In particular, make sure to not share any files that contain the key! Be careful when committing files to Git and keep appropriate permissions!
Any person that obtains the access token of a user can access the Gitlab using the user’s identity. If you suspect that your access token has been shared, reset the key immediately in the SMHI Gitlab!
If a valid access token has been configured (and experiment.monitoring.activate is true),
then the monitoring system creates an issue under the
“EC-Earth monitoring” project on Gitlab
at the end of the first leg.
The title of the issue will be constructed as {{experiment.id}}:
{{experiment.description}} and the status will initially be ongoing.
This is an example:

Fig. 2 Gitlab issue created by the monitoring system
The issue will be updated after each leg automatically and data will be added to the time series and other plots. As further examples, here are the sea-level pressure time series after 30 model years:
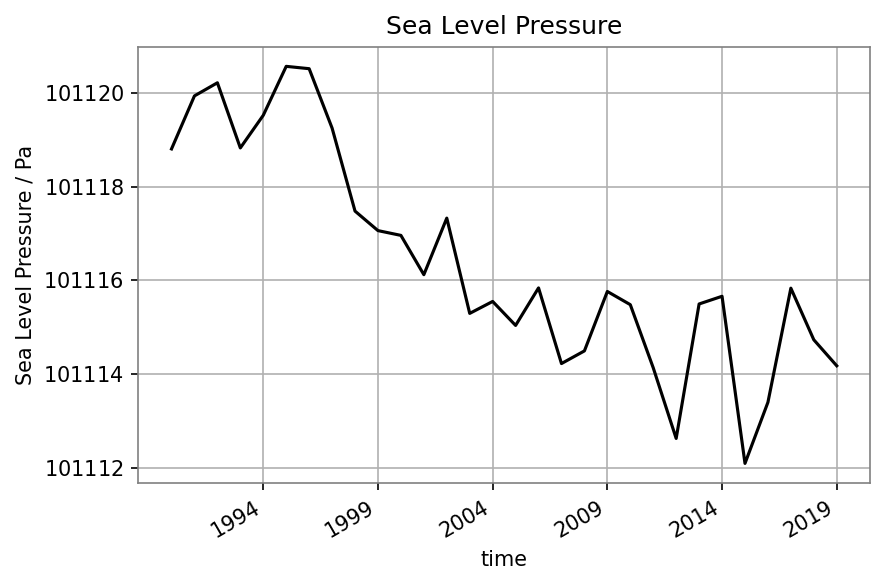
Fig. 3 Time series for sea-level pressure
and the map of average sea-level pressure:
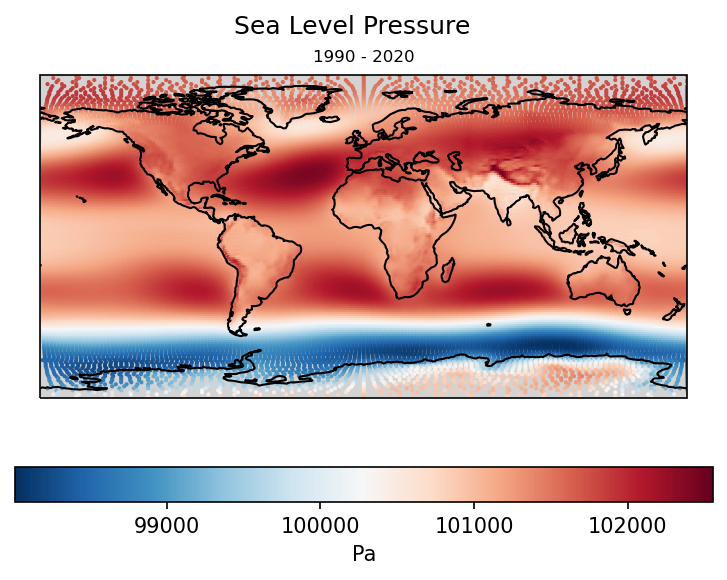
Fig. 4 Simulation average map for sea-level pressure
For the September sea-ice concentration, an animated map is produced:
Fig. 5 Northern hemisphere sea-ice concentration for September
Because the monitoring of ongoing experiments creates regular Gitlab issues, it is possible to interact on the page just as for any other issue, e.g. engaging in discussions about the experiment by adding comments.
Warning
Because the monitoring system will add information to the SMHI Gitlab automatically, some care has to be taken. It is advised to switch on the Gitlab feature of the monitoring system only with the intention to share the results.
It is possible to switch on Gitlab upload of monitoring later on in the experiment run. As long as monitoring (without Gitlab) has been activated before, data will be generated and uploaded at the next end of a leg.